Data Visualization as a Cognitive Tool: Theory and Practice (2025 Guide)
data visualization cognitive tool
90% of information transmitted to the brain is visual (MIT Neuroscience). Data visualization leverages this by:
✅ Reducing cognitive load (vs. raw numbers)
✅ Enhancing pattern recognition (50% faster insights)
✅ Improving memory retention (65% recall after 3 days vs. 10% for text)
2. Core Psychological Principles
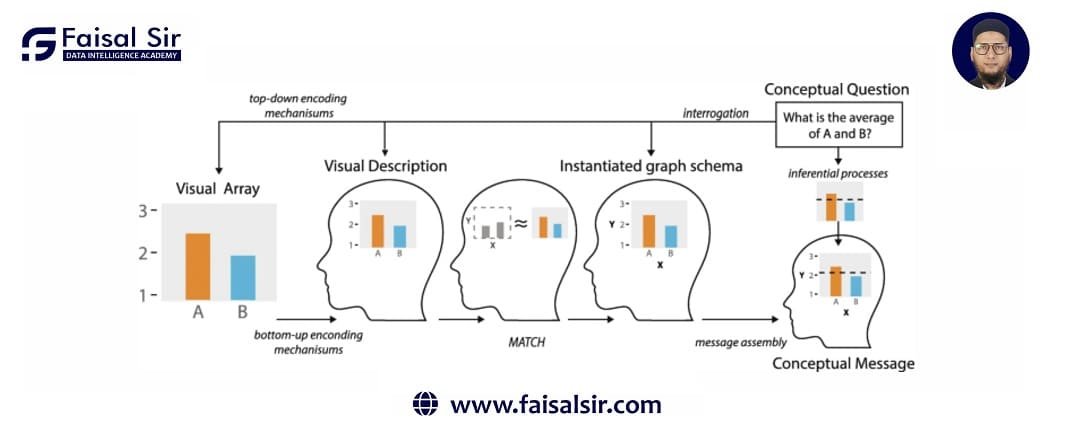
A. Preattentive Processing
How the brain instantly detects:
- Color (hue/saturation)
- Orientation (tilted bars)
- Size (area comparisons)
Best Practice:
python
# Highlight key data points
import matplotlib.pyplot as plt
plt.scatter(x, y, c=np.where(z>threshold, 'red', 'grey'))
B. Gestalt Principles
| Principle | Visualization Application |
|---|---|
| Proximity | Group related dashboard elements |
| Similarity | Use consistent colors for same metrics |
| Closure | Use icons instead of detailed drawings |
3. Evidence-Based Visualization Techniques
A. For Analytical Thinking
1. Small Multiples (Tufte’s favorite)
- Compare 50+ dimensions without clutter
- Tools: Tableau’s trellis charts, ggplot2 facets
2. Interactive Filtering
- Lets users test hypotheses
- Example: Bloomberg terminal dashboards
B. For Persuasive Communication
1. Narrative Visualizations
- Story structure: Setup → Conflict → Resolution
- Tools: Flourish, Datawrapper
2. Annotations
- Guide attention like a museum curator
- Example:pythonCopyDownloadimport seaborn as sns ax = sns.lineplot(data=df) ax.annotate(‘COVID impact’, xy=(2020, peak_value))
4. Cognitive Pitfalls to Avoid
A. Misleading the Visual Cortex
| Mistake | Fix |
|---|---|
| Truncated y-axis | Always start at 0 for bar charts |
| Over-smoothing | Show raw data points alongside trends |
B. Choice Overload
✔ Apply the “3-Second Rule” (key insight should be instantly visible)
✔ Use layered disclosure (details on hover/click)
5. Case Study: Spotify’s Annual Wrapped
Cognitive Design Wins:
- Personalization (activates dopamine response)
- Micro-interactions (play buttons build engagement)
- Shareability (social proof triggers FOMO)
(Source: Spotify Design Blog)
6. Free Resources
- [Template]: Cognitive-Friendly Dashboard (Figma)
- [Checklist]: 10-Point Visualization Audit
🎨 Lead Magnet:
“Get our Data Visualization Psychology Cheat Sheet (PDF)”
📊 Master This Skill:
Data Storytelling Certification Course
7. Future Trends (2025)
- AI-powered automatic chart selection
- Neuroscience-informed dashboard designs
- AR/VR immersive data experiences